This tutorial explains how to navigate in the Urban SIS datasets using our data portal. Click on the menu item ACCESS ECV:s & INDICATORS above to get to the data portal.
Content
General functionality:
Functionality via the menu item ACCESS ECV:s and INDICATORS above:
Functionality via the menu item ACCESS GRIDS above
Functionality via the menu item ACCESS ECV:s and INDICATORS above
Select data to display on the map
| Click on Add data in the upper right corner of the data portal. |  |
| A menu will fold out that displays the available datasets. Click of the one you are interested in to select it. |  |
| The first timestep of the data will be shown in the map. | 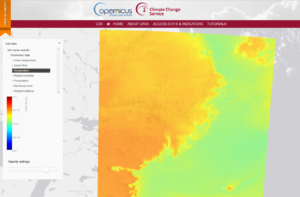 |
Navigate in the map
| To zoom in the map, use the + and – buttons to the upper right in the window. It is also possible to zoom using the mouse scroll wheel or by holding down shift and the left mouse button to select an area of interest.
Menues can be toggled on and of in order to leave more space for the map by using the leftmost button under the probe windows. To pane in the map, hold down the left mouse button and move the map to the desired position. |
 |
| The data layer can be made transparent by using the opacity slider at the bottom of the data pane to the left in the widow. (This is not possible if you are in the ACCESS grids application GRIDS) |  |
Functionality via the menu item ACCESS ECV:s and INDICATORS above
Explore time series
| When a data layer has been selected, the user can explore a timeseries for any point in the dataset by a left click on that point. Doing this a graph will appear att the bottom of the page showing data for the full period for the selected point. |  |
| If desired, it is possible to click on more points of interest. All points are listed with a name in the upper right pane. To remove one probe, click on the trash bin.
Time series for all selected points a shown in the graph at the bottom of the page. By clicking in the list to the right it is possible to remove one of the graphs. It is possible to select which time step that is shown on the by clicking in the graph. |
 |
| The user can zoom in to an interesting period by holding down the left mouse button and drag over the timeline for the period of interest. To zoom out again select a period (1month, 6 month, 1 year or all data) to the upper left of the graph window. | |
 |
|
Save views and download time series data
| At any time, an interesting view can be saved by clicking on the save button in the right pane. The middle button, with the four squares, shows a list of all saved views during a session. | 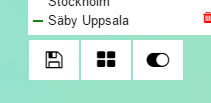 |
| The list of views shows selected information that allows the user to identify the saved views. |  |
| To return to a selected view, click on the play icon at the top left corner. To delete a view click on the cross at the right corner. |  |
| To export data from the selected probes, select csv under export as and click on download. Data will be exported as ASCII. |  |
Functionality via the menu item ACCESS GRIDS above
Download grids as NetCDF
| Select the dataset you are interested in as described above. A blue box that mark the area where data is available will appear on the map. |  |
| You can select a subset of the area by holding dow the Ctrl-key and left mouse button and drag over the area you want. It is also possible to select a subset of the available time span for the data by adjusting the dates in the top pane. |  |
| To download your selected data click the save button on the upper right corner. |  |